Business Intelligence and Financial Data Strategy

by: Ann Marie Svoboda
August 6, 2019
Advancements in business intelligence (“BI”) bring new quantities and dimensions of data to Corporate Finance. The combination of faster networks, cheaper data storage, and BI platforms such as Tableau and Microsoft Power BI offer break-through opportunities for financial presentation. It’s amazing. The speed and capacity with which we are now able to analyze massive amounts of disparate data is a game-changer.
But there are common misconceptions about this new frontier. Related marketing suggests the BI platforms are magical. BI salesmen suggest we can simply push a button to see infinite volumes of charts and graphs that solve every conceivable analytical problem. Don’t be fooled. It doesn’t work that way.
Yes, the new technologies perform calculations at lightning speed and offer expansive dimensions in data analysis. But the problem is not with the technology. The problem is with the data. Wrangling these innovative analytical opportunities is a fool’s errand without a defined financial data strategy.
A Disorganized Approach
At the base level, managing financial data has rules. Generally Accepted Accounting Principals (“GAAP”) govern the structure of accounting, and since GAAP defines the structure and content of financial reporting, there is a predefined financial data strategy. Finance teams build a standard chart of accounts (“CoA”) to support the financial reporting system. Using the CoA data structure, along with some consolidation and adjustments, it’s clear how to present the Income Statement or Balance Sheet. Problems arise, though, when considering data either behind or ancillary to the consolidated general ledger (“GL”) data.
Consider this simple example. An analyst working at Imaginary Company wants to use their new BI software to analyze the Finance function’s costs. She first imports data into the common BI data pool. Assuming that the BI system already supports basic data such as the CoA and currency translation, the analyst imports 1) detailed GL data and forecasts associated with the Finance function’s cost center accounts, 2) related data from the Purchase Order (“PO”) system, and 3) vendor master data. She then builds field relationships within the BI reporting tool, linking vendor information to the PO data and likewise PO data to the ledger system data. A summary chart resulting from this effort appears below.
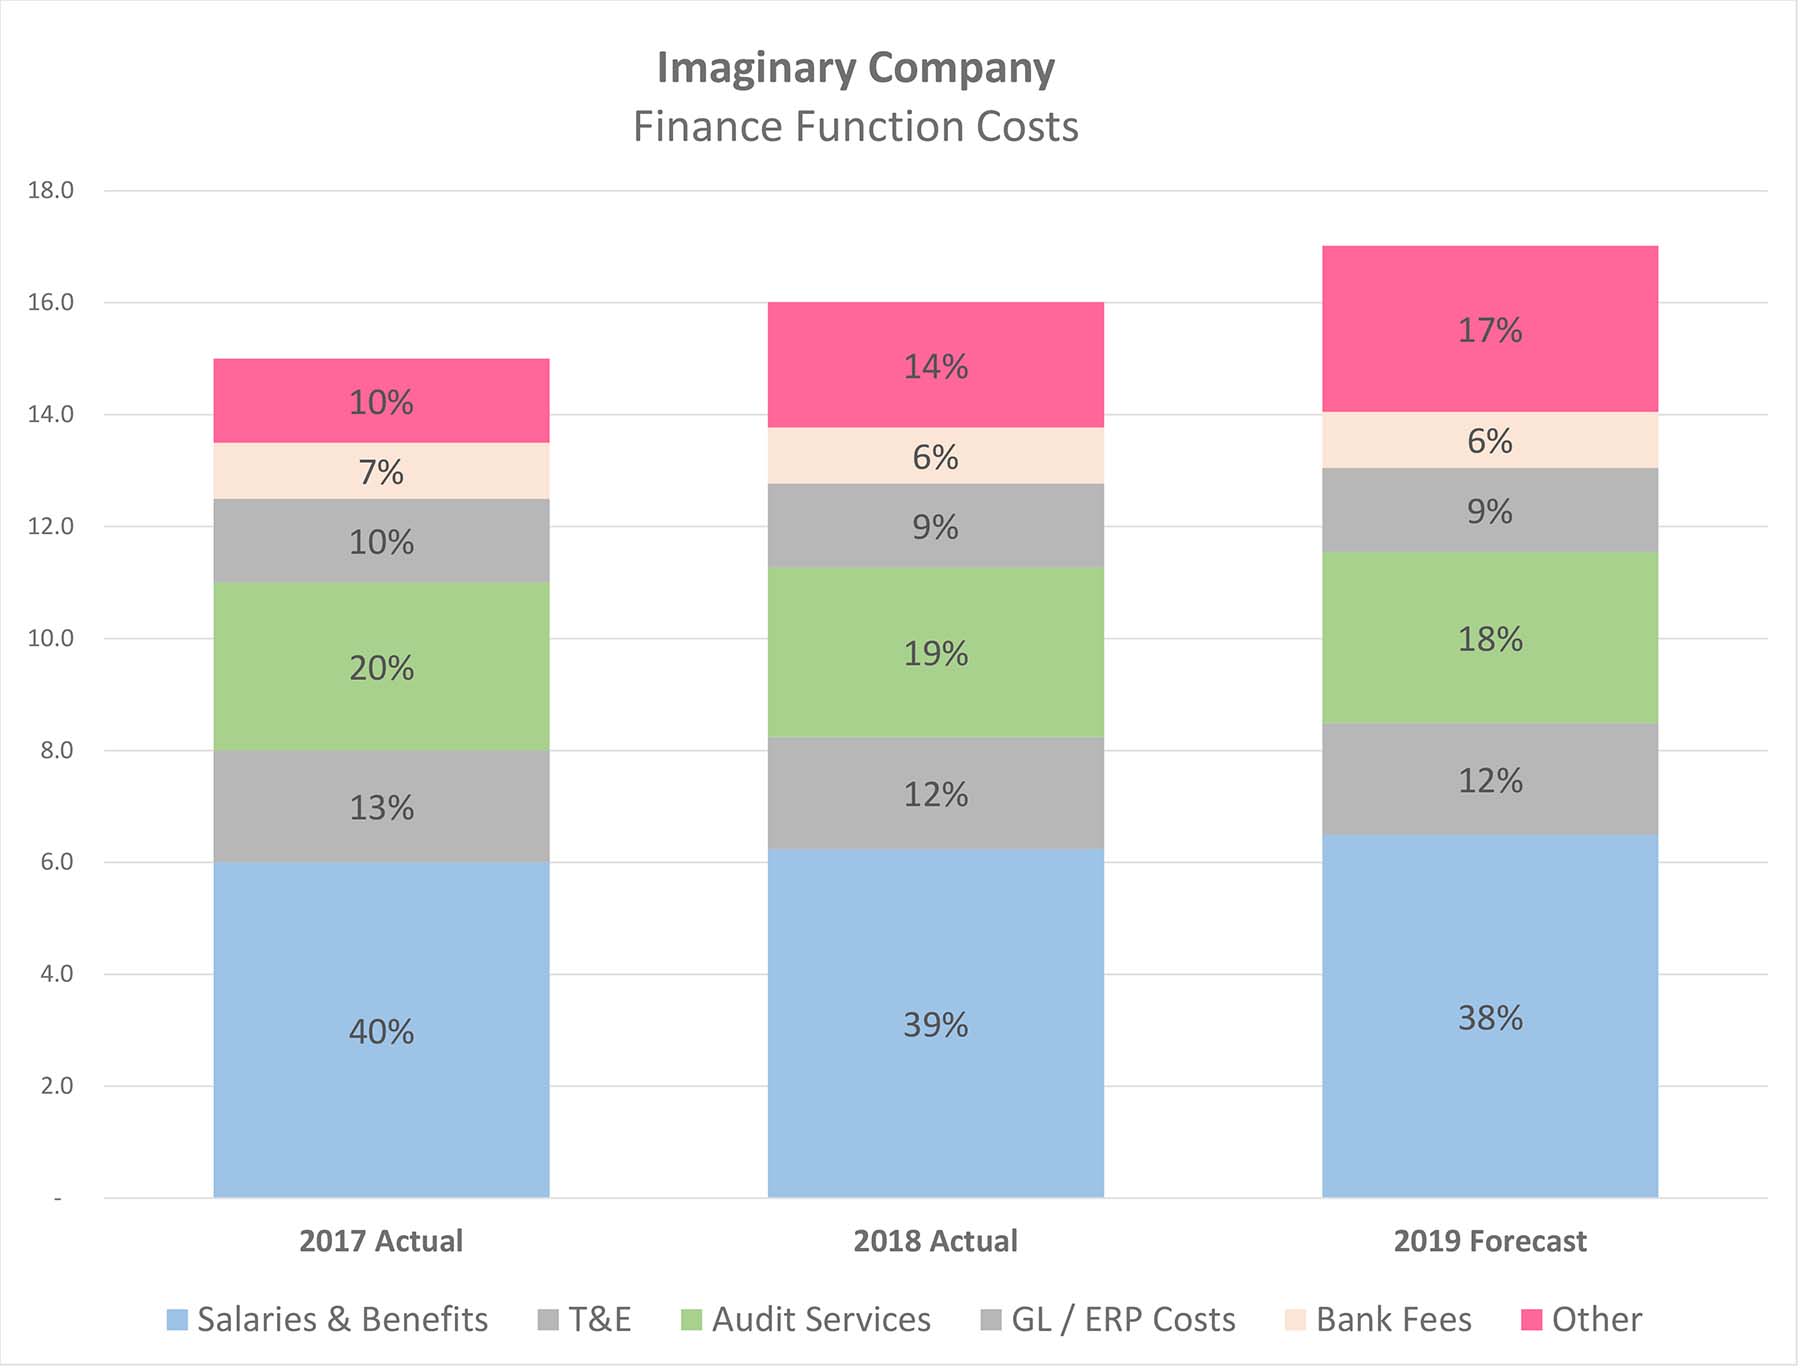
The chart shows the component costs of the Finance function across the 3 sample periods. In this example, the BI software allows extended analysis by clicking through individual cost categories to view alternative graphs analyzing chosen variables such as vendor, currency, or geography. At first glance, that seems very cool. The problem, though, is that this “magic” is not very enlightening.
Note that each component cost is growing year-over-year in line with inflation, apart from “Other.” The Other cost category is growing faster than expected and therefore requires further review. Here, our Imaginary Company analyst hits a snag. She cannot drill into the Other category. The BI system identified these costs as Other because the imported data did not fit the predefined data relationship parameters. No useful information exists beneath the summary presentation to explain the disconnected expense growth.
Why are these costs labeled as Other? It's possible that the problematic data originated from an isolated GL ledger, represents expenses that were processed manually, or relates to extraordinary payments incurred outside the PO process. Each possibility ensures incomplete analytics.
Fixing this analytical disconnect requires incremental work. Possible solutions involve enhancements to the underlying sub-ledger data architecture, changes to the operational processes that create such data, or Artificial Intelligence-driven data enhancements within the BI platform. Whatever the solution, the fix is not a simple analytical exercise.
More importantly, our Imaginary Company analyst shouldn’t have been surprised by this inconsistent data problem. Someone must have analyzed the Finance functional costs before, thereby uncovering the existence of misaligned data. But why didn’t that knowledge get incorporated into the financial data structure within the BI platform? The answer is that this exercise ignored the need for a financial data strategy.
An Organized Approach
Effective Business Intelligence projects do not start with data import but with the development of a financial data strategy.
Analytical Goals
The first step in developing a financial data strategy requires the definition of BI-related analytical goals. You shouldn’t expect to move all the company’s financial analysis into the BI platform, so you need to define the boundaries of the financial BI objectives.
The outline of analytical goals supports the design of an efficient financial data strategy. Without a defined set of objectives, you will find yourself trying to perfect every field of financial data and build logical relationships between every conceptual data set. Defined goals, on the other hand, direct a streamlined BI data hierarchy and ensure clear expectations for BI analytics.
Due Diligence
The path to defining BI analytical goals begins with due diligence over your company’s existing analytics. Start by inventorying all the routine reporting and analyses that the finance team creates today. This list should matrix the relevant dimensions of each analysis; categorizing aspects such as frequency, data source(s), work product owners, and intended audiences.
Don’t limit this inventory to the habits of the Corporate Finance team. It is imperative to also collaborate with the Business Unit and Regional Finance teams. Meet with each finance group to discuss their routine analyses. Gather samples of the reports and confirm each report's purpose. Consider whether the reports are used to dissect backward-looking variance analysis or to create forecasts.
Assess the resulting analysis list in the context of your company needs. Is the collection of analytical work, when taken as a whole, organized and strategic? Think about how the universe of analyses guide company strategy and support decision making. Consider relationships, dependencies, and redundancies in the list. Also identify weaknesses; recognizing limitations, incongruences, and outright neglect in analytical coverage. Review the list with executive management, the strategy team(s), and relevant functional leadership to qualify how their strategic needs align with the current analytical output.
Data-specific Due Diligence
The next step in due diligence examines the data. Now that you have qualified the analysis inventory, you must work to quantify it.
First, identify the specific data source(s) used to create each analysis listed in the inventory. Then examine the data architecture of each data source, working with the system owners of each master database to understand data hierarchies, controls, size, and location.
As you work through this review, identify existing master data relationships across the inventory and compare those consistencies with the quality of analytical output. More importantly, identify inconsistencies and inefficiencies in the data architecture. Watch for the following problems:
- One common issue is misalignment in master data across disparate systems. For example, if your company uses multiple GL sub-ledgers, each with a distinct CoA, there is misalignment in the CoA data architecture.
- Another issue involves inconsistencies in the application of information within a specific set of master data. For example, the customer master data system may not ensure consistent naming conventions for common ownership, thereby thwarting the ability to identify customer concentrations.
- Some data will not exist in the inventoried data architecture(s). This discussion, so far, has considered structured data from enterprise resource planning (“ERP”) systems. But your strategic review likely identified needs to incorporate data outside the ERP, such as competitor data, market data, or unstructured data garnered from the Internet of Things.
After compiling this information, review the due diligence with IT leadership. Collaboratively discuss the problems and identify solutions to each data disconnect, qualifying available options and resources to align the data.
Putting it Together
The resulting due diligence supports the development of BI-related analytical goals and a financial data strategy. This is the ultimate planning step and is the final planning action needed before implementation. (see endnotes)
First, consider the core analytics in the analysis inventory. Your review should have qualified the company's central reports, specifically the reports that every other analysis works to support, explain, or reconcile to. These core reports are the analytics identified as central to managing financial strategy.
With those core analytics in mind, work through the remaining analytical inventory to identify strategic importance. How does each analysis relate to the core reports, and more importantly, help guide the execution of corporate strategy? Assign an associated grading system to each inventory item, grading analyses with broad strategic usefulness and a large audience higher grades than narrow analytics.
Next, work through the analysis inventory to identify reporting that can garner the most benefit from the BI analysis tools. Which reports involve the largest quantity of data and, simultaneously, the least cohesive data infrastructure (or rather, require the most data manipulation and time to create)? Further, which of these dense and time-consuming reports would be faster and better if built within the BI platform? Assign a different grading system to this exercise, assigning high grades to those reports that need the BI system tools the most.
Using a cross-section of the two grading systems, you can now identify specific reports, having the highest combined grades, that are worthy of development within the BI platform. This list defines your BI analytical goals. see endnotes
The identification of those specific analyses, then, drives your financial data strategy. You previously identified the data that supports each report within the analytical goals, and you mapped the data relationships, inconsistencies, and ancillary problems involved with those data sets. You can now consolidate that data due diligence into a data strategy, defining the specific relationships, reconciliations, and data fixes needed to align and complete the data.
The above instructions serve as an outline for creating a financial data strategy to support BI reporting goals. This guidance directs an organized approach to transpose your company’s financial analysis into a BI platform. Through this organization, your financial Business Intelligence output will ensure strategic enlightenment.
Endnotes
- Comparisons of BI platforms are available from Gartner and SelectHub
- Note that the “core reports” may or may not be suitable for incorporation into the BI platform, but the financial data strategy must accommodate analysis to reconcile BI platform reporting with the core reports.
Header Image: © adam121 - stock.adobe.com
Chart image: © Blackworth Publishing LLC